Paraver
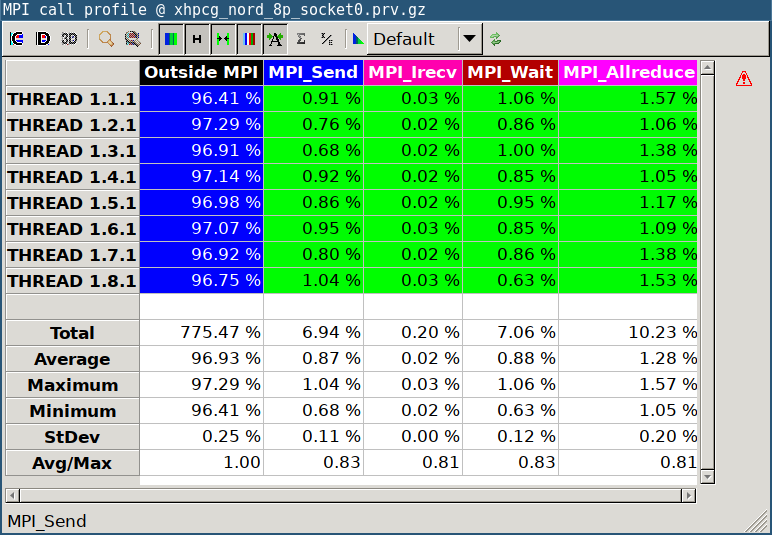
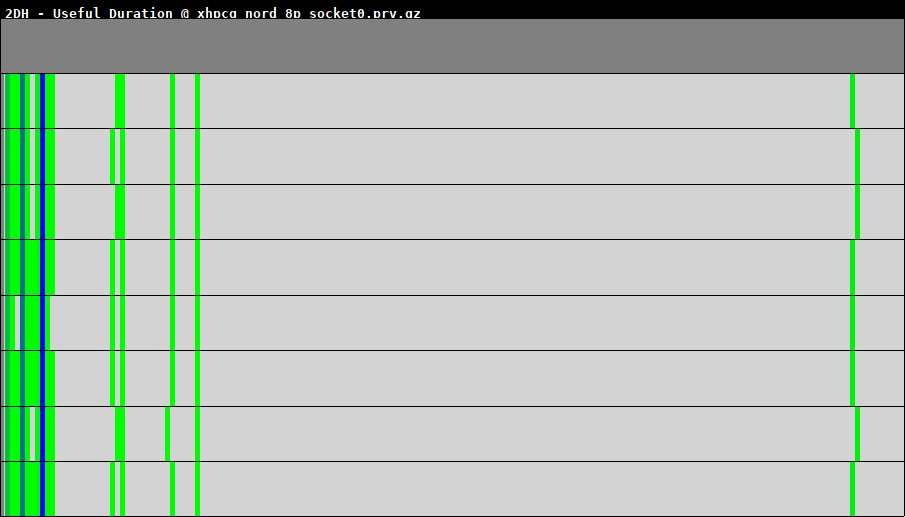
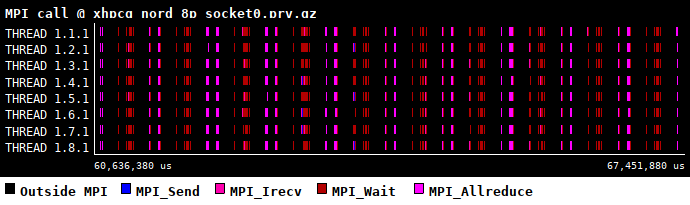
Paraver is a performance analyser based on event traces with a great flexibility to explore the collected data, supporting a detailed analysis of the variability and distribution of multiple metrics with the objective of understanding the application’s behaviour. Paraver has two main views: The timeline view (Figure 1) displays the application behaviour over time, while statistics views (profiles as shown fin Figure 2 plus histograms as shown in Figure 3) complement the analysis with distribution of metrics. To facilitate extracting insight from detailed performance data, during the last years new modules introduce additional performance analytics techniques: clustering, tracking and folding allow the performance analyst to identify the program structure, study its evolution and look at the internal structure of the computation phases. The tool has been demonstrated to be very useful for performance analysis studies, with unique features that reveal profound details about an application’s behaviour and performance.
Goals within DEEP-SEA
In DEEP-SEA, Paraver will be extended with new features to support launching and analysing PROFET data directly from the graphical interface. This includes a new API to communicate with external tools and a new launch dialog to seamlessly run PROFET analyses on loaded traces.
Website: https://tools.bsc.es/paraver